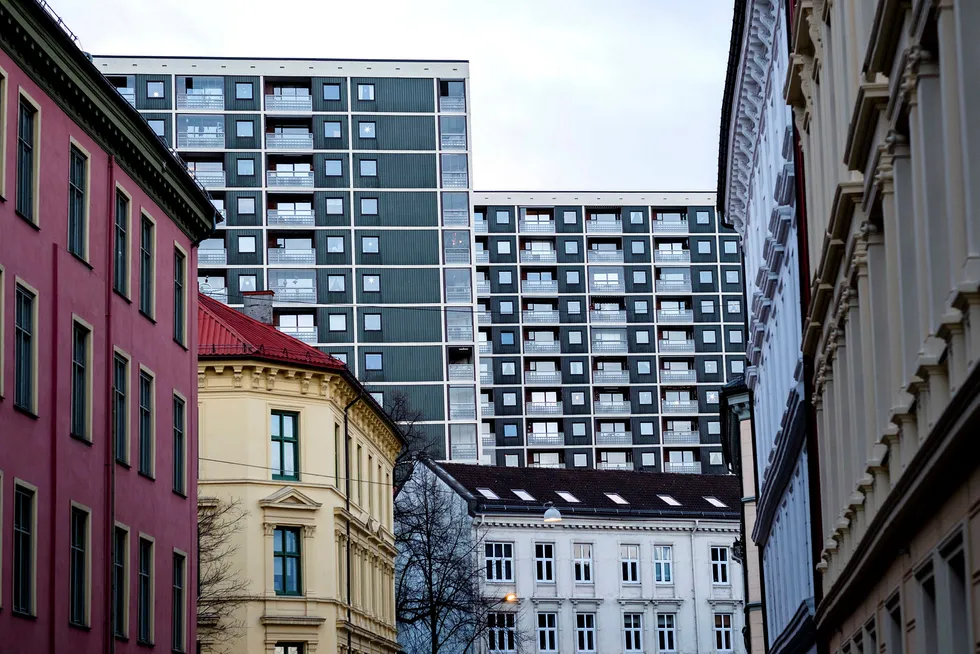
Sted | Endring siste måned % | Endring siste 12 mnd % | Pris median bolig | Gjennomsnittlig formidlingstid |
Fredrikstad | -0,5 % | 6,7 % | 2 637 904 | 38 |
Moss | -0,4 % | 6,2 % | 2 739 219 | 24 |
Sarpsborg | -0,6 % | 3,2 % | 2 350 000 | 47 |
Resten av Østfold | -0,4 % | 8,4 % | 2 550 000 | 46 |
Østfold | -0,5 % | 6,6 % | 2 565 000 | 41 |
Asker | -0,5 % | 0,1 % | 5 075 122 | 29 |
Bærum | -0,6 % | 0,7 % | 5 065 477 | 37 |
Follo | -0,5 % | 2,5 % | 4 300 000 | 42 |
Nedre Romerike | -0,6 % | 0,1 % | 3 469 229 | 39 |
Øvre Romerike | -0,5 % | 0,3 % | 3 030 000 | 37 |
Akershus | -0,6 % | 0,8 % | 3 900 000 | 38 |
O1 Gamle Oslo | -1,1 % | -6,3 % | 3 607 000 | 31 |
O2 Grünerløkka | -1,1 % | -8,3 % | 3 635 715 | 33 |
O3 Sagene | -1,0 % | -7,5 % | 3 607 000 | 33 |
O4 St.Hanshaugen | -0,9 % | -6,7 % | 4 242 703 | 34 |
O5 Frogner | -0,8 % | -7,1 % | 5 150 000 | 54 |
O6 Ullern | -0,8 % | -3,6 % | 6 131 000 | 37 |
O7 Vestre Aker | -0,9 % | -3,2 % | 5 954 000 | 44 |
O8 Nordre Aker | -1,0 % | -5,4 % | 4 730 500 | 41 |
O9 Bjerke | -1,3 % | -6,0 % | 3 537 479 | 46 |
O10 Grorud | -1,3 % | -7,0 % | 2 857 251 | 23 |
O11 Stovner | -1,4 % | -4,0 % | 3 290 000 | 35 |
O12 Alna | -1,3 % | -5,5 % | 3 108 538 | 46 |
O13 Østensjø | -1,1 % | -7,1 % | 3 345 026 | 44 |
O14 Nordstrand | -1,1 % | -4,1 % | 3 820 000 | 46 |
O15 Søndre Nordstrand | -0,6 % | -3,1 % | 3 348 827 | 54 |
Oslo | -1,0 % | -6,2 % | 3 730 747 | 39 |
Hamar | -0,7 % | 5,2 % | 2 605 000 | 25 |
Hedmark utenom Hamar | -0,6 % | 5,9 % | 2 000 000 | 67 |
Hedmark | -0,6 % | 5,7 % | 2 131 374 | 59 |
Lillehammer | -0,4 % | 3,6 % | 2 697 867 | 39 |
Oppland utenom Lillehammer | -0,4 % | 4,7 % | 2 150 000 | 58 |
Oppland | -0,4 % | 4,4 % | 2 272 919 | 54 |
Drammen | -0,5 % | 4,1 % | 2 901 507 | 25 |
Buskerud utenom Drammen | -0,4 % | 6,5 % | 2 850 000 | 39 |
Buskerud | -0,4 % | 5,6 % | 2 879 305 | 35 |
Larvik | -0,4 % | -0,5 % | 2 350 000 | 106 |
Sandefjord | -0,3 % | 1,4 % | 2 450 000 | 69 |
Tønsberg | -0,6 % | 2,5 % | 2 850 000 | 76 |
Vestfold utenom Tønsb, Sandefj, Larvik | -0,7 % | 3,3 % | 2 660 000 | 51 |
Vestfold | -0,5 % | 2,0 % | 2 620 000 | 74 |
Porsgrunn | -0,9 % | 1,5 % | 1 988 568 | 54 |
Skien | -0,4 % | 2,2 % | 2 000 000 | 53 |
Telemark utenom Skien, Porsgr | -0,2 % | 5,5 % | 1 942 174 | 41 |
Telemark | -0,5 % | 3,0 % | 1 971 683 | 49 |
Aust-Agder | -1,6 % | -1,0 % | 2 190 000 | 119 |
Kristiansand | -1,2 % | -2,7 % | 2 390 456 | 94 |
Vest-Agder utenom Kristians | -1,0 % | -0,7 % | 2 150 000 | 180 |
Vest-Agder | -1,1 % | -1,9 % | 2 265 000 | 126 |
Sandnes | -1,5 % | -3,4 % | 3 000 000 | 104 |
S1 Hundvåg | -1,3 % | -0,9 % | 3 300 000 | 93 |
S2 Tasta | -1,0 % | 1,5 % | 3 450 000 | 64 |
S3 Eiganes og Våland | -1,1 % | 0,7 % | 3 350 000 | 49 |
S4 Madla | -0,8 % | 0,1 % | 3 142 500 | 57 |
S5 Storhaug | -1,0 % | -2,0 % | 2 750 000 | 98 |
S6 Hillevåg | -1,3 % | -0,3 % | 2 796 658 | 75 |
S7 Hinna | -0,9 % | 1,5 % | 3 925 000 | 78 |
Stavanger | -1,0 % | 0,0 % | 3 169 786 | 72 |
Haugesund | -1,2 % | -1,3 % | 1 950 000 | 185 |
Rogaland utenom Stav, Sand, Haug | -1,3 % | -0,9 % | 2 700 000 | 132 |
Rogaland | -1,2 % | -1,1 % | 2 890 000 | 111 |
B1 Arna | -2,1 % | -6,7 % | 2 755 000 | 18 |
B2 Bergen sentrum | -2,3 % | -6,4 % | 3 200 000 | 52 |
B3 Fana | -2,0 % | -5,7 % | 3 373 243 | 34 |
B4 Fyllingsdalen | -2,5 % | -7,5 % | 2 686 000 | 42 |
B5 Laksevåg | -2,0 % | -6,2 % | 2 365 000 | 47 |
B6 Loddefjord | -2,3 % | -5,8 % | 2 629 698 | 58 |
B7 Sandviken | -2,0 % | -5,9 % | 2 900 000 | 52 |
B8 Ytrebygda | -2,2 % | -5,3 % | 3 790 000 | 92 |
B9 Årstad | -2,3 % | -5,0 % | 2 731 044 | 58 |
B10 Åsane | -2,1 % | -6,6 % | 2 850 000 | 36 |
Bergen | -2,2 % | -6,0 % | 2 851 394 | 50 |
Hordaland utenom Bergen | -1,9 % | -3,4 % | 2 700 000 | 89 |
Hordaland | -2,1 % | -5,4 % | 2 800 000 | 61 |
Sogn & Fjordane | -2,2 % | -3,1 % | 2 451 547 | 71 |
Ålesund | -1,2 % | -3,3 % | 2 557 000 | 84 |
Møre og Romsdal utenom Ålesund | -1,3 % | -1,4 % | 2 200 000 | 105 |
Møre & Romsdal | -1,3 % | -2,0 % | 2 300 000 | 99 |
T1 Trondheim Sentrum | -1,6 % | -3,3 % | 2 990 807 | 53 |
T2 Trondheim Øst | -1,4 % | -3,1 % | 3 129 484 | 57 |
T3 Trondheim Vest | -1,4 % | -0,8 % | 3 390 000 | 34 |
T4 Trondheim Sør | -1,4 % | -3,7 % | 2 836 073 | 44 |
Trondheim | -1,4 % | -2,9 % | 3 068 756 | 50 |
Sør-Trøndelag utenom Trondheim | -1,3 % | -0,9 % | 2 540 000 | 66 |
Sør-Trøndelag | -1,4 % | -2,5 % | 2 960 000 | 54 |
Nord-Trøndelag | -1,3 % | 0,3 % | 2 050 000 | 77 |
Bodø | -1,2 % | 0,9 % | 2 936 215 | 64 |
Nordland utenom Bodø | -1,5 % | -0,2 % | 2 150 000 | 71 |
Nordland | -1,4 % | 0,2 % | 2 430 787 | 70 |
Tromsø | -1,5 % | -1,8 % | 3 353 259 | 49 |
Troms utenom Trømsø | -1,5 % | -0,2 % | 2 350 000 | 79 |
Troms | -1,5 % | -1,4 % | 3 061 424 | 58 |
Finnmark | -1,7 % | 1,7 % | 2 482 412 | 87 |
Norge | -1,1 % | -2,1 % | 2 995 000 | 61 |