I’m lazy, that may be my best geek quality
Meet the Lego enthusiast who became a cybernetics engineer – and now envisions the future.
“My point is that I do nothing...”
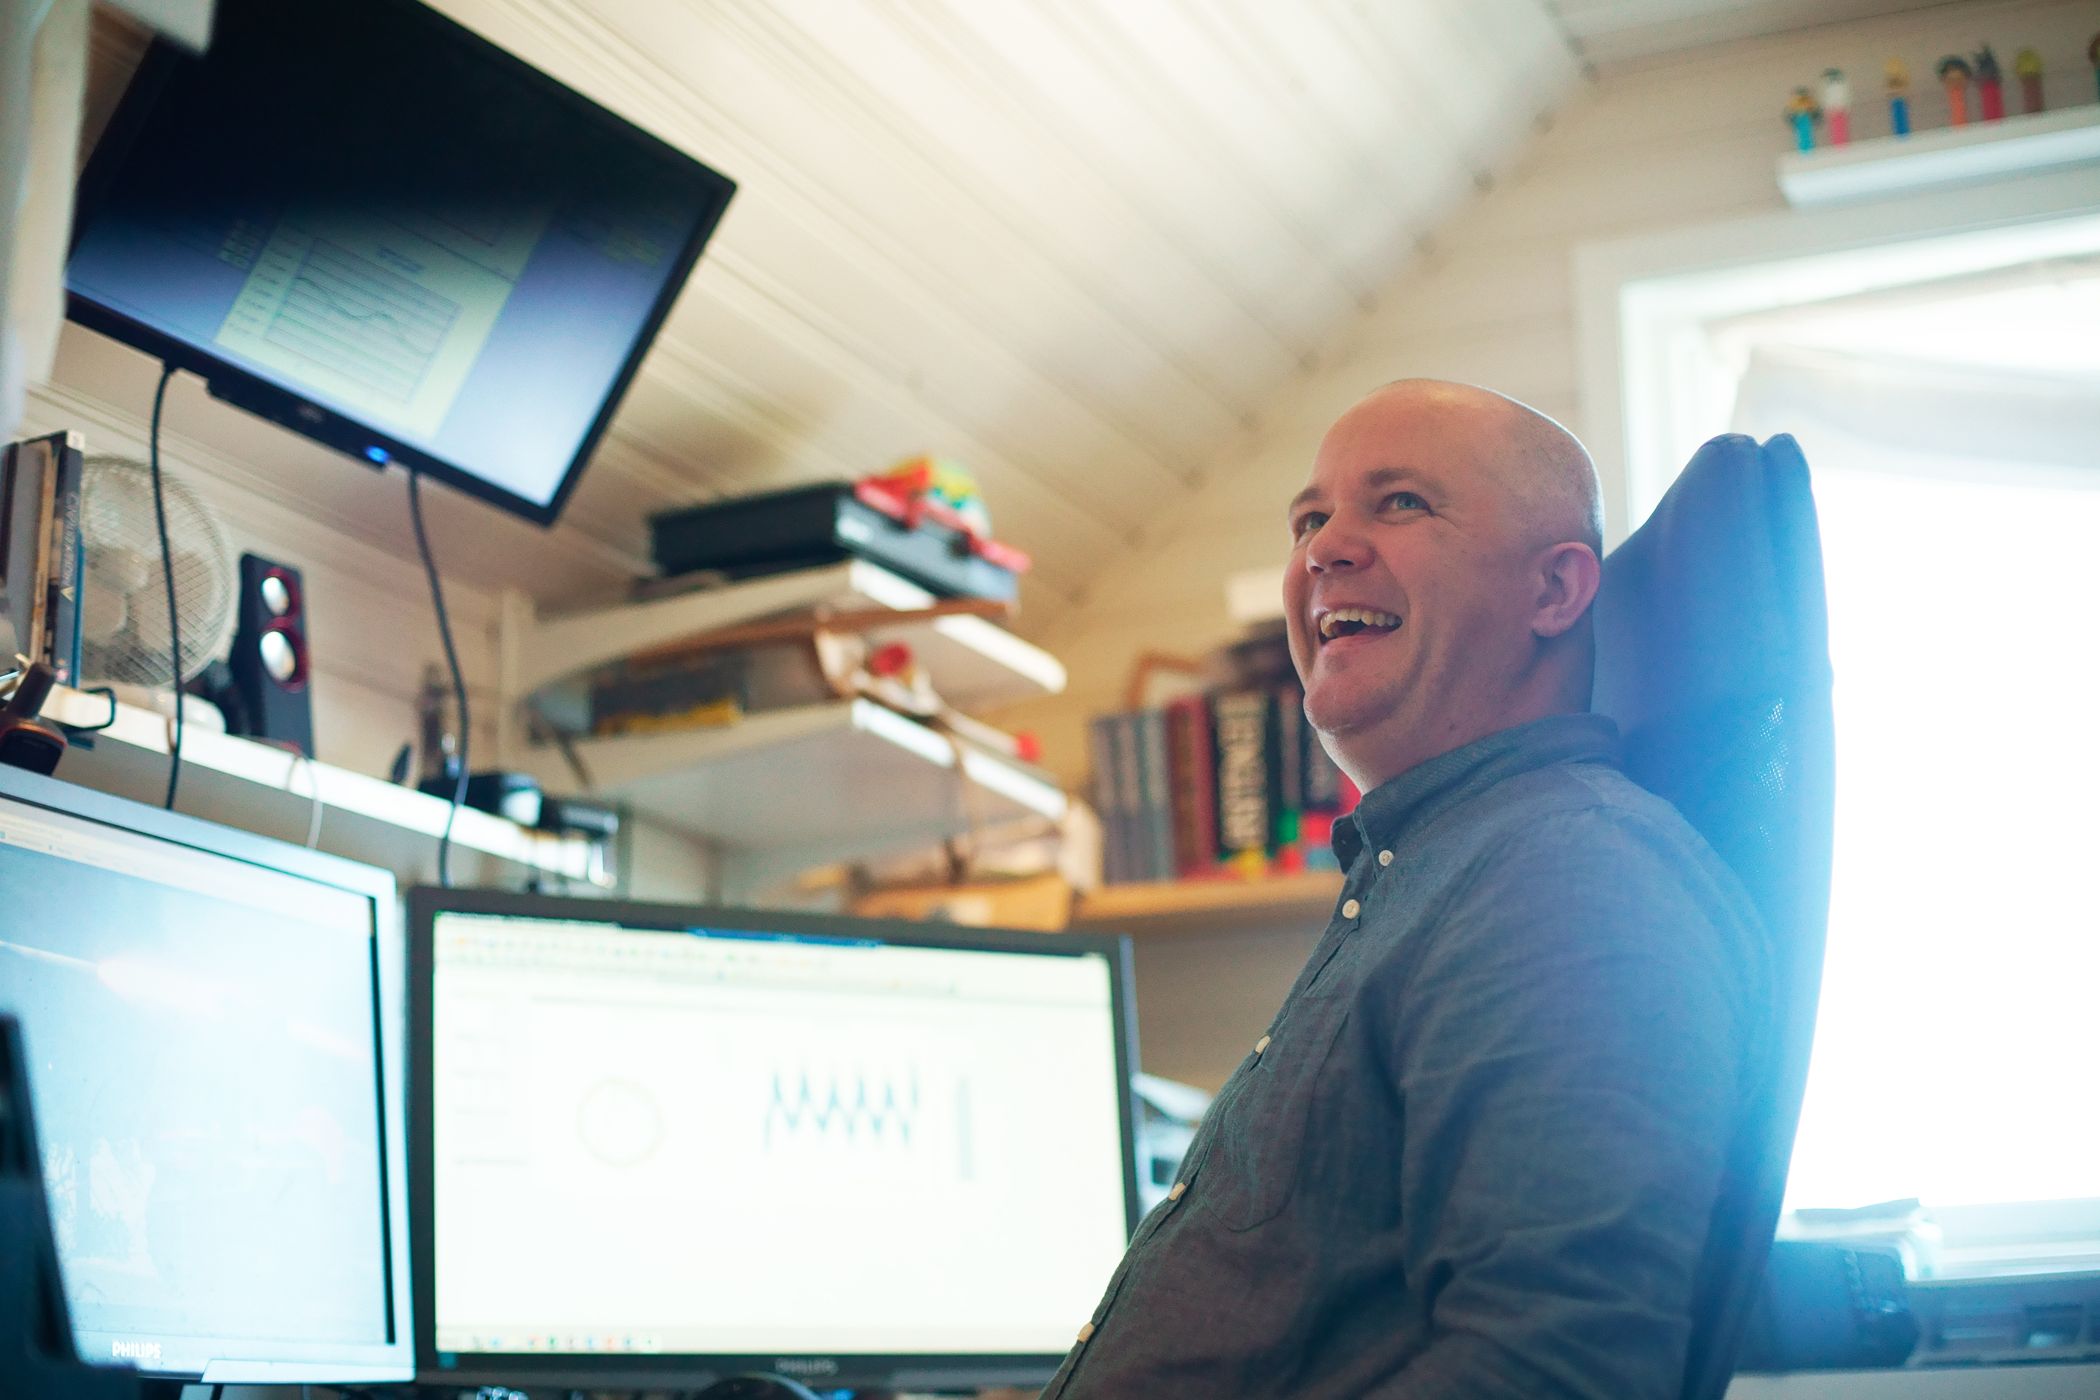
Hans Erik Raustein offers morning coffee and points around the living room in his yellow townhouse in Ålgård on the outskirts of Sandnes. In the street outside, the neighbourhood is waking to a new day.
“So, I turn on the light when I get up, but otherwise everything happens automatically.”

“Ugh… this doesn’t seem right,” says Hans Erik Raustein from the ‘control room’ at home in his townhouse at Ålgård. From here, the engineer can control the components of his own smart house. All photos: Fredrik Harper
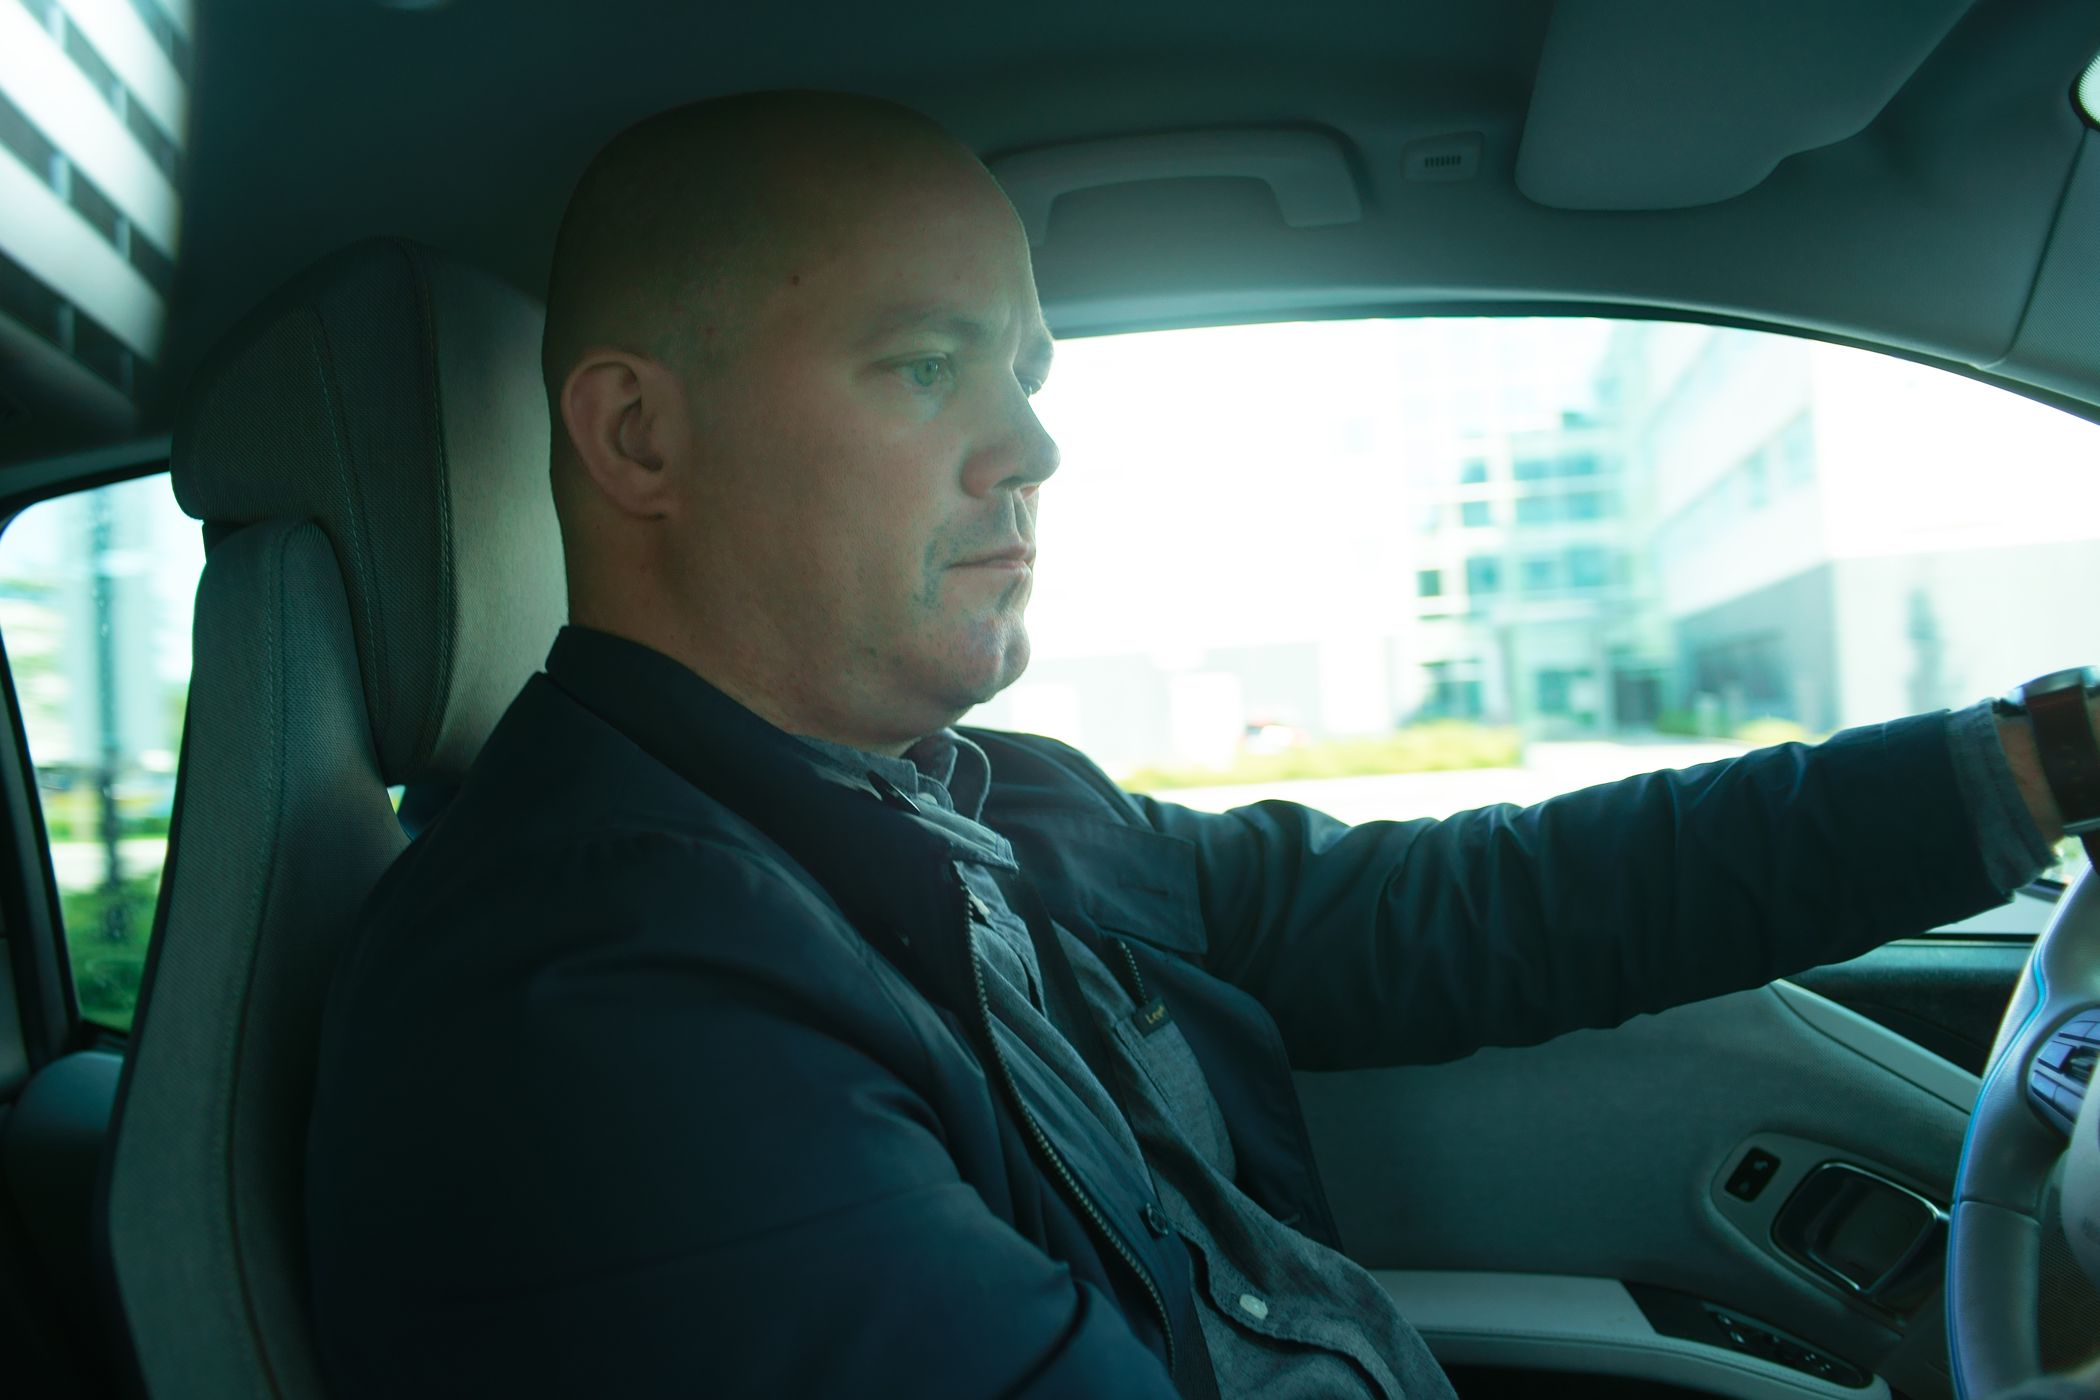
When Hans Erik rushes off to work in a few minutes, he will get into his electric BMW i3 and drive just under nineteen kilometres to the Siemens office in Forus. All while the townhouse at Ålgård starts a life all of its own.
“Do you see that device by the electrical socket there? It logs the temperature every 15 minutes. I have several such sensors all around, it’s cheap stuff you find at [the DIY outlet] Clas Ohlson, but they are well-suited for this use.”
An engineer and father of young children, he has created his own smart house system. The sensors located around the house send information to a computer, where an algorithm determines what will happen next.
“I have set up a database where I log the temperature and decide what the rules should be.”
The house’s brain then determines whether it should turn up the heat in preparation of the return of the family, or whether it should be lowered if they leave on holiday.
“This is a very basic homemade setup, nothing fancy. Indeed, there are ready-made solutions you can buy – but I think it’s fun to create them yourself.”

In the car on his way to work, Hans Erik explains how the interest in electronics has shaped his life.
Laziness generates innovation
Several of Hans Erik’s merits focus on simplifying manual tasks.
“My best geek quality is actually that I’m lazy. And then I don’t like listening to boring things. Many good things can come from programming and combining these two things,” says Hans Erik while demonstrating a graph that shows the average temperature of the house throughout the year.
“I got a lot of support from vocational training, but later I gained an interest in management systems, and the physics behind the elements you want to control.”
His interest in electronics has a double background. Part of it originates from his vocational training, while the programming aspect was developed during his further training in cybernetics at the Norwegian University of Science and Technology (NTNU) in Trondheim.
“Actually, I was an only-child and heir, but I was more interested in Lego than taking over the family farm.”
In his career he has worked with far more complex processes, such as participating in the development of military missile management systems.
“It was incredibly exciting for a newly graduated electrical engineer. We were out on a shooting range in Telemark and got to fire rockets and stuff.”
“Much of what I’ve been working with has been about automating complex tasks. I’m a geek and proud of it.”
He was also involved in the development of the legendary ‘Bottle Cork Vacuum Cleaner’ – an intricate system installed at the Student Union, where bottles we automatically uncorked and the corks transported to the waste bin via a vacuum-based piping system.
“Yes, maybe I was involved in the first generation of that device, but we won’t talk a lot about that...

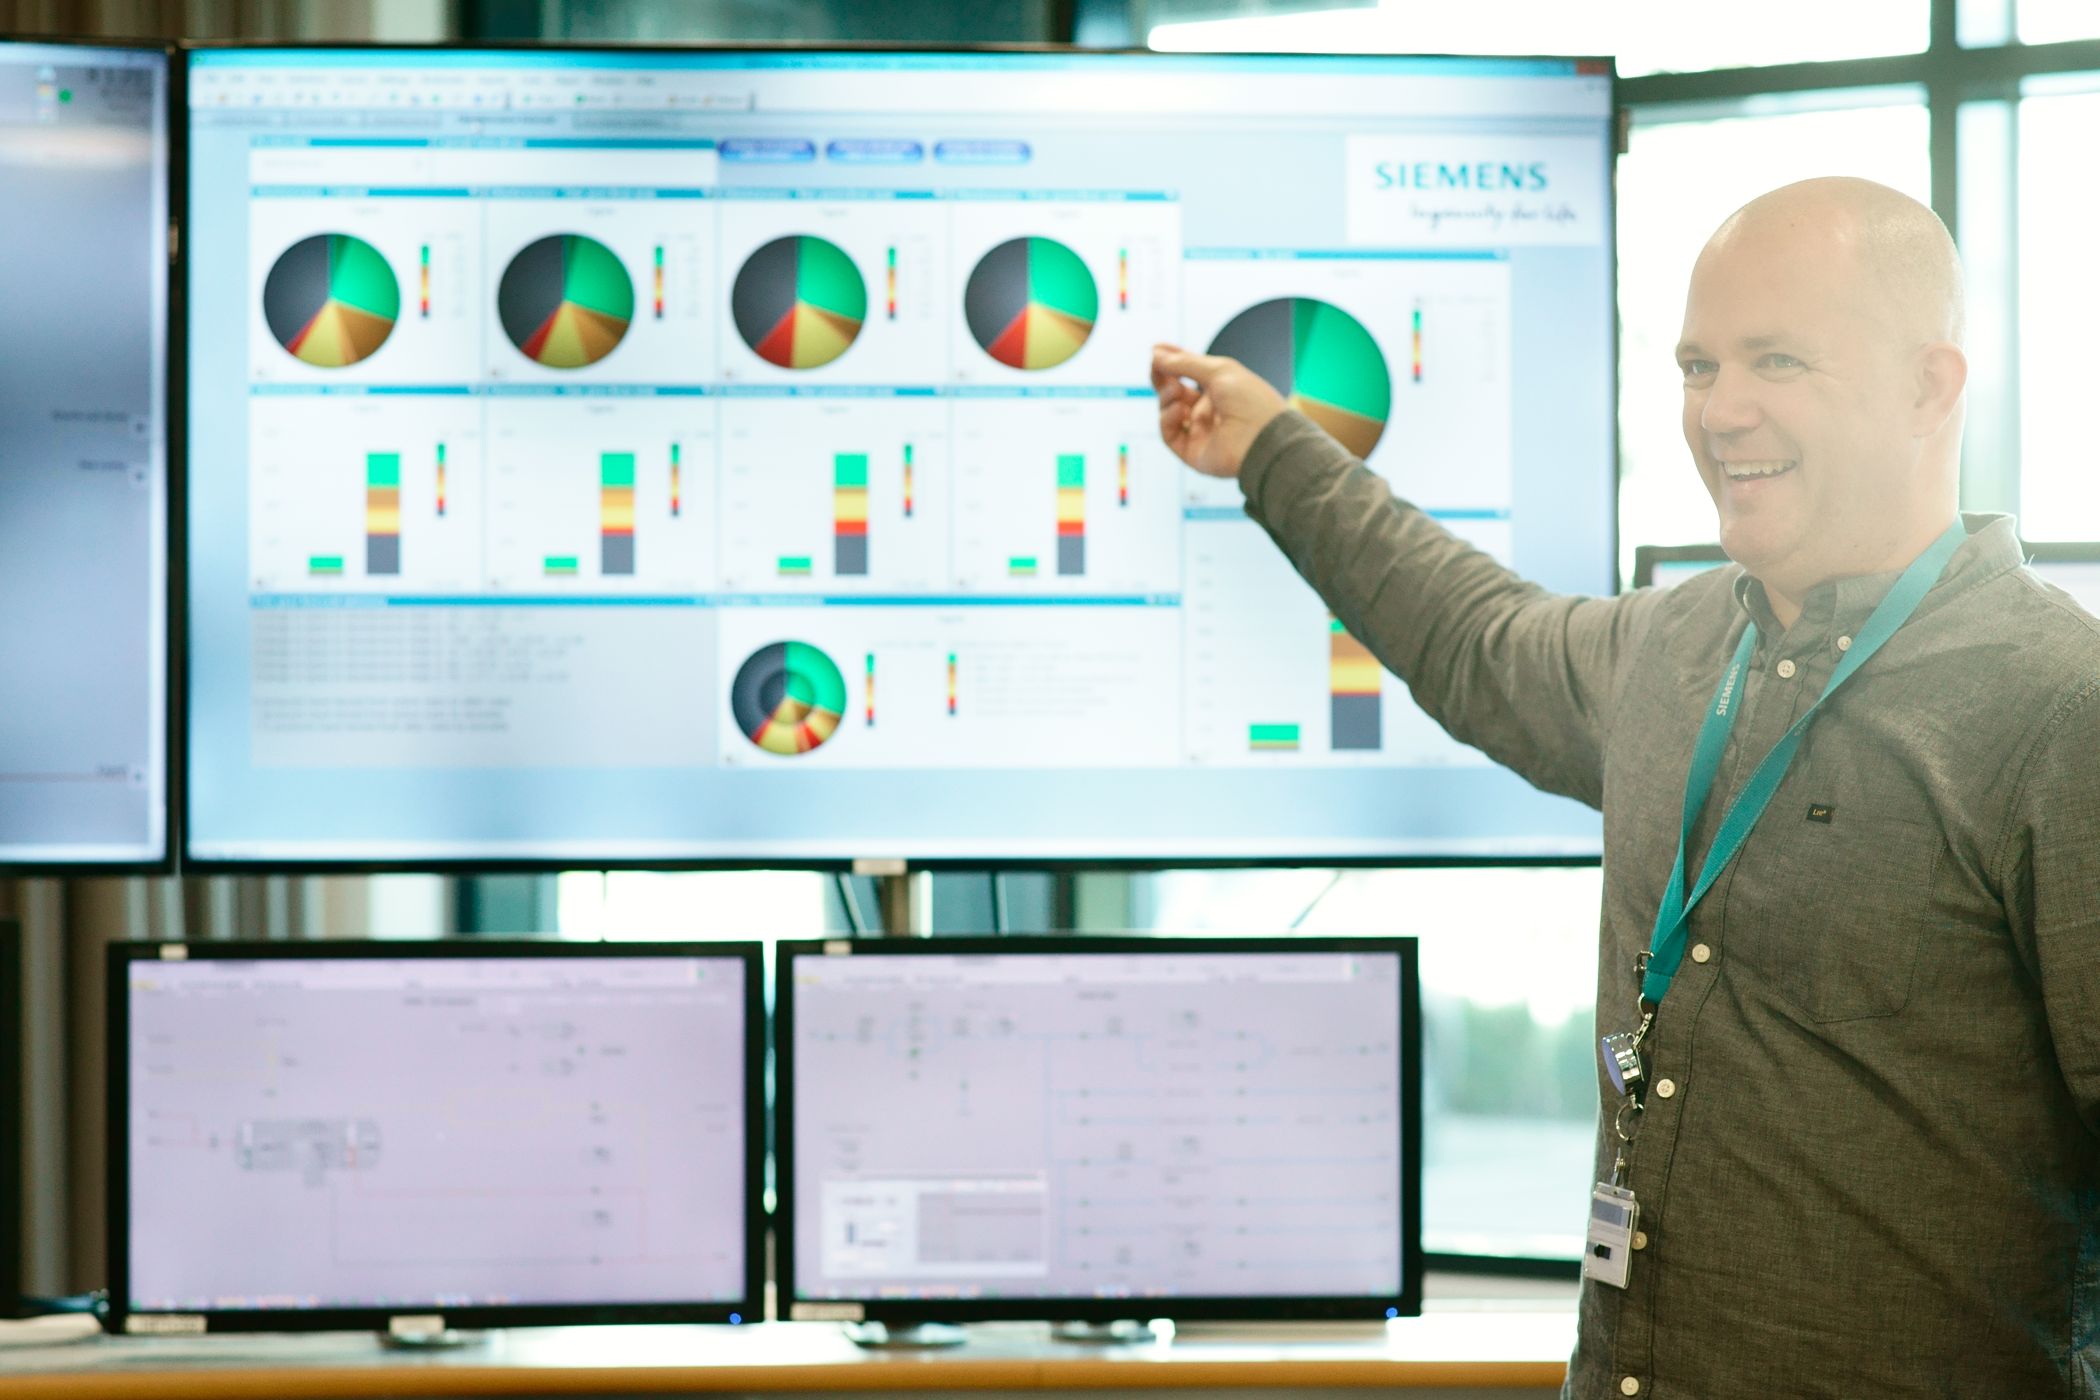
Sales Engineer Hans Erik Raustein demonstrates how planned obsolescence is handled at Siemens.
The visualisation
As Sales Engineer at Siemens in Stavanger, he has automated his own tasks as well as those of others – with overwhelming results.
“This is in some ways a kind of visualisation of the future,” says Raustein, pointing to a wide screen with pie charts in signal colours like red, yellow and green.
“This way of visualising is incredibly effective, and helps both our engineers and customers,” says Raustein.
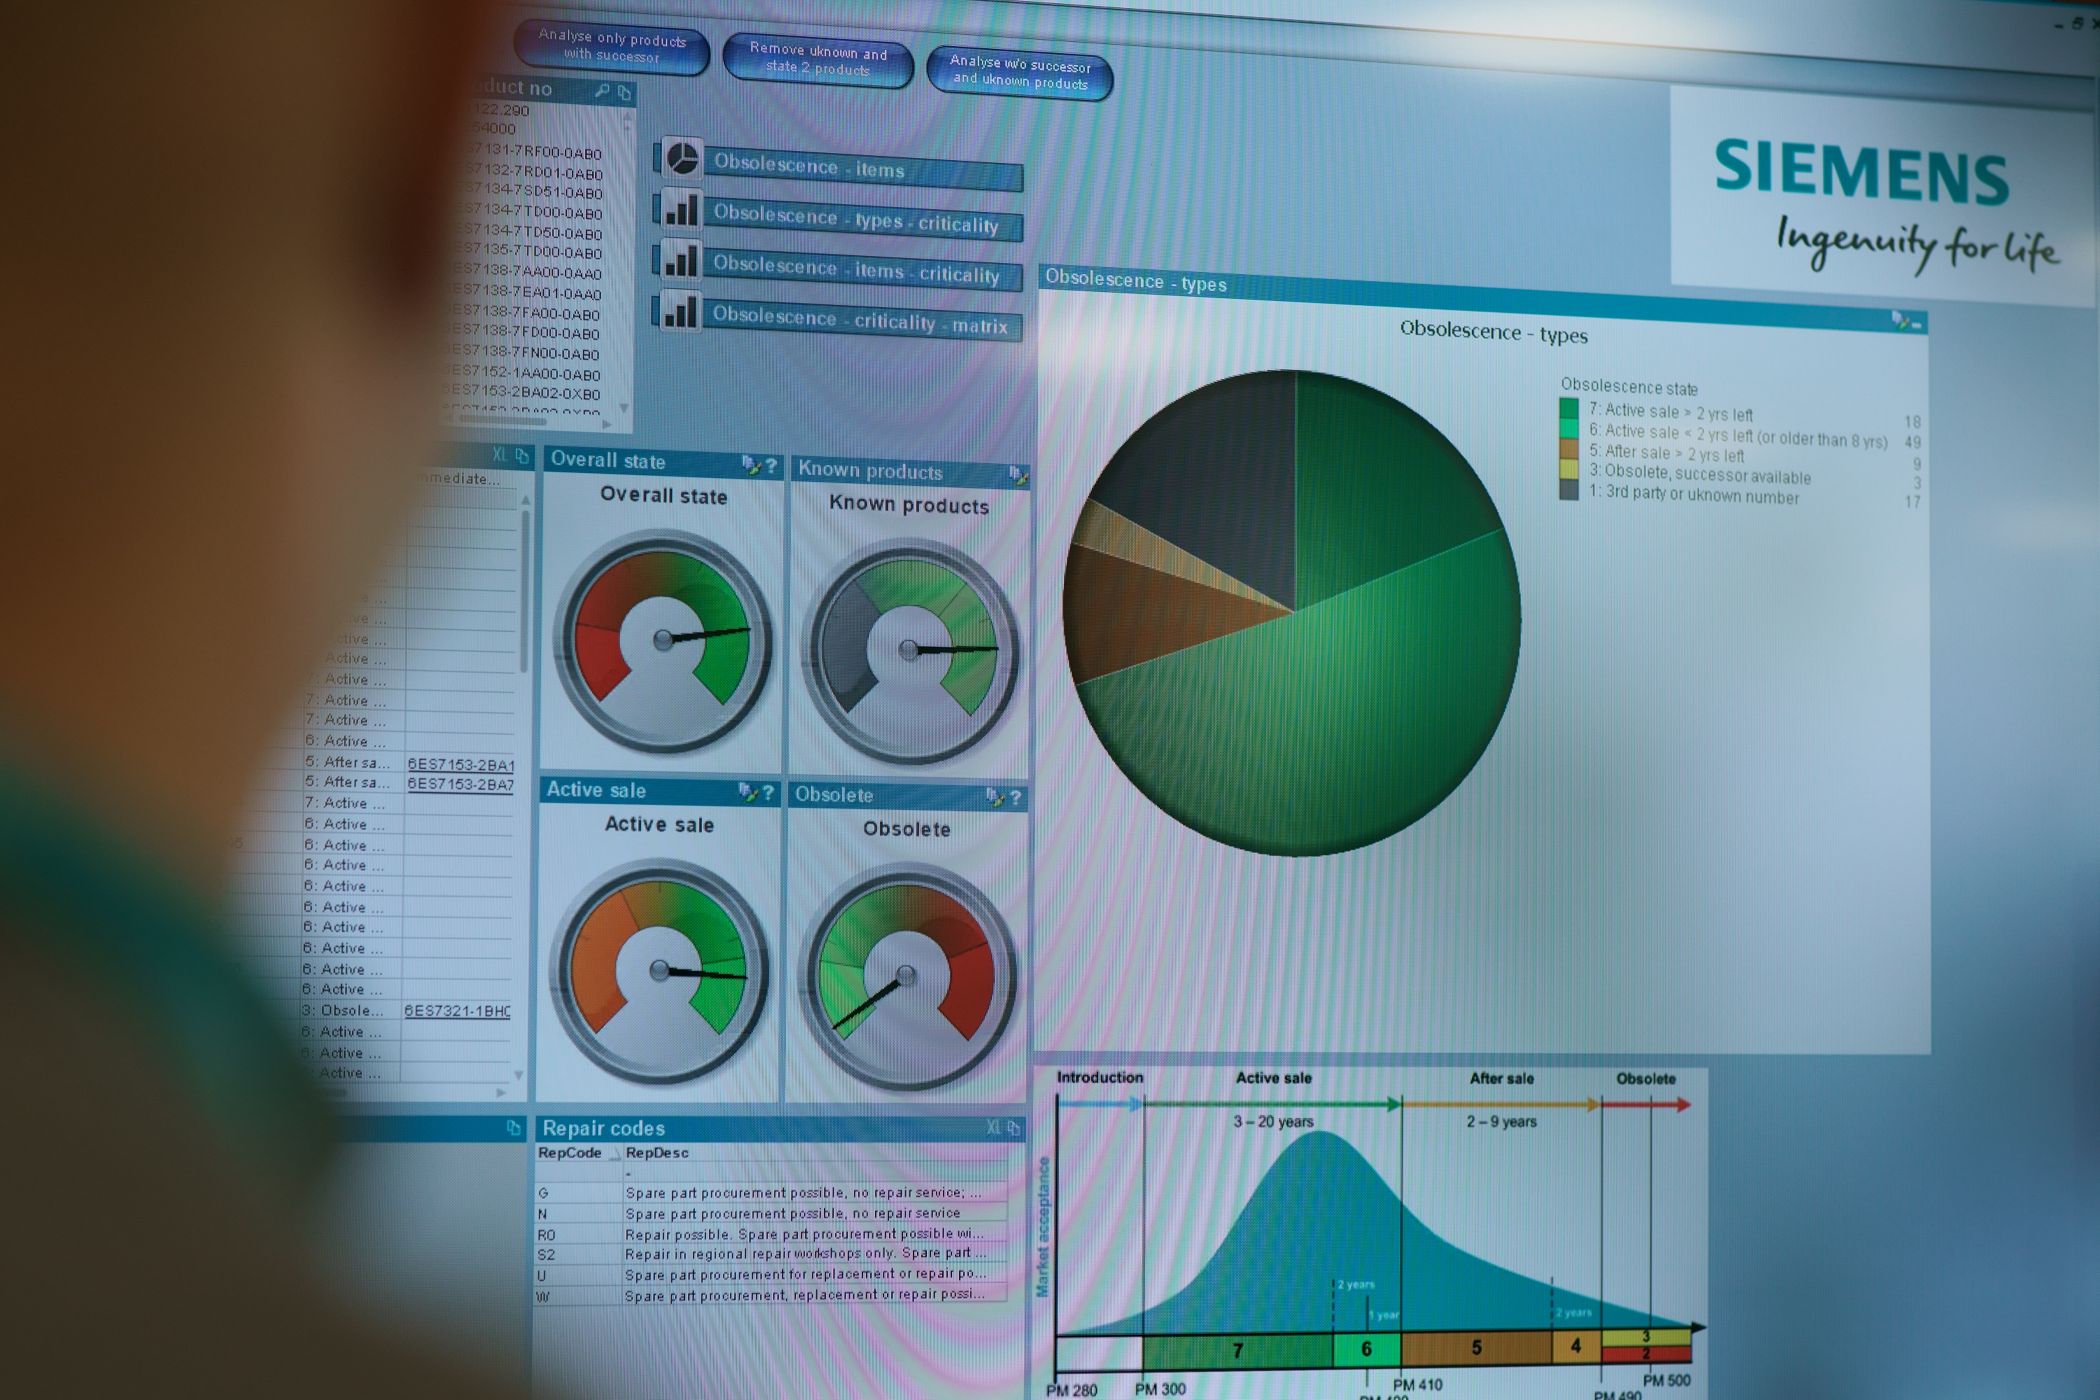
“What you see here is really a situation analysis, in this case for a major oil installation in the North Sea. The colours indicate which of the electrical components are at risk of creating problems – and draining the customer of money.”

“Red means potential downtime, and in the offshore context this soon becomes a question of big money,” says Engineer Hans Erik Raustein.
Big money
Downtime is a foul word in an offshore context. The costs can quickly rise to several million NOK a day.
“What I have done is to gather information about different components, right down to the part number and where the components are located in the installations. Then I have taken this list and combined it with Siemens’ database of planned dates when the different components should be replaced.”
So far so good, but Hans Erik’s assignment was to find out how this information can be made easy to understand for the customers. The amount of information is overwhelming.
“The previous system we used was terribly cumbersome. And difficult. And time consuming.”
Hans Erik’s solution was therefore to visualise the information so that everyone can easily see which components are at risk. This makes it easier for engineers to gain an overview and provide concrete advice.
“We also have a responsibility for being in the lead. The result is that we can more easily avoid something breaking down and that it doesn’t take months to repair or replace. This is a very systematic and structured way of showing how we work.

“I was an only-child and family farm heir, but I preferred to play with Lego,” says Engineer Hans Erik Raustein.
For the customer, it is also very useful since they can bring this image to their management and say: “that’s the way it is now.” Such a thing is simply about saving money and avoiding long downtime.
“In the past, we could spend a lot of time compiling such a report. Now, we have made this interactive and precise, and not least visual. You can tap the red area on the screen and it automatically retrieves information about all critical components.
– What was your thought the first time you saw the visualisation?
“I think I got a bit excited, to say the least, and thought that we really must do more of this.”